Fulfillment Centre Bottleneck Analysis
A fulfillment centre tests express prioritisation, machine maintenance windows, and throughput limits using constraint-based scheduling to find what really drives delays.
Setup
A fulfillment centre handles 10 jobs/day across 9 machines (Receiving, Storage, Picking, Packing, Shipping, Express Pick, Palletize, Inspection, Kitting). Six order types follow different routes through the facility:
Machines: Bottleneck Light load Normal
| Order Type | Theo Duration | Deadline |
|---|---|---|
| Standard B2C (×3) | 16h | 24–32h |
| Express (×2) | 11h | 14–16h |
| B2B Pallet (×2) | 15h | 27–31h |
| Kitting (×1) | 21h | 31h |
| Returns (×1) | 22h | 34h |
| Heavy Pallet (×1) | 29h | 42h |
50 operations total, each pinned to a specific machine with fixed durations and precedence constraints. Aggregate machine workload across all jobs: Picking 38h, Packing 34h — these are the primary bottlenecks. Express Pick (6h), Inspection (6h), and Kitting (5h) are lightly loaded.
We build the schedule as a constraint optimization problem using MiniZinc + OR-Tools CP-SAT, minimising total tardiness (sum of positive lateness across all jobs). The baseline schedule achieves a 55h makespan with 4 of 10 jobs late and 35 hours of tardiness, indicating structural delays that persist under optimal scheduling due to capacity constraints.
Model assumptions: deterministic processing times, no stochastic arrivals or machine breakdowns, single-machine per operation, full observability of all jobs at t=0.
We evaluate three operational levers: prioritisation policy, capacity allocation, and demand elasticity.
Experiment 1: Express Priority & Extra Packing
Does prioritising express orders help, and does adding a second Packing station pay off?
| Scenario | Makespan | Total Tardiness | Late Jobs | Max Tardiness |
|---|---|---|---|---|
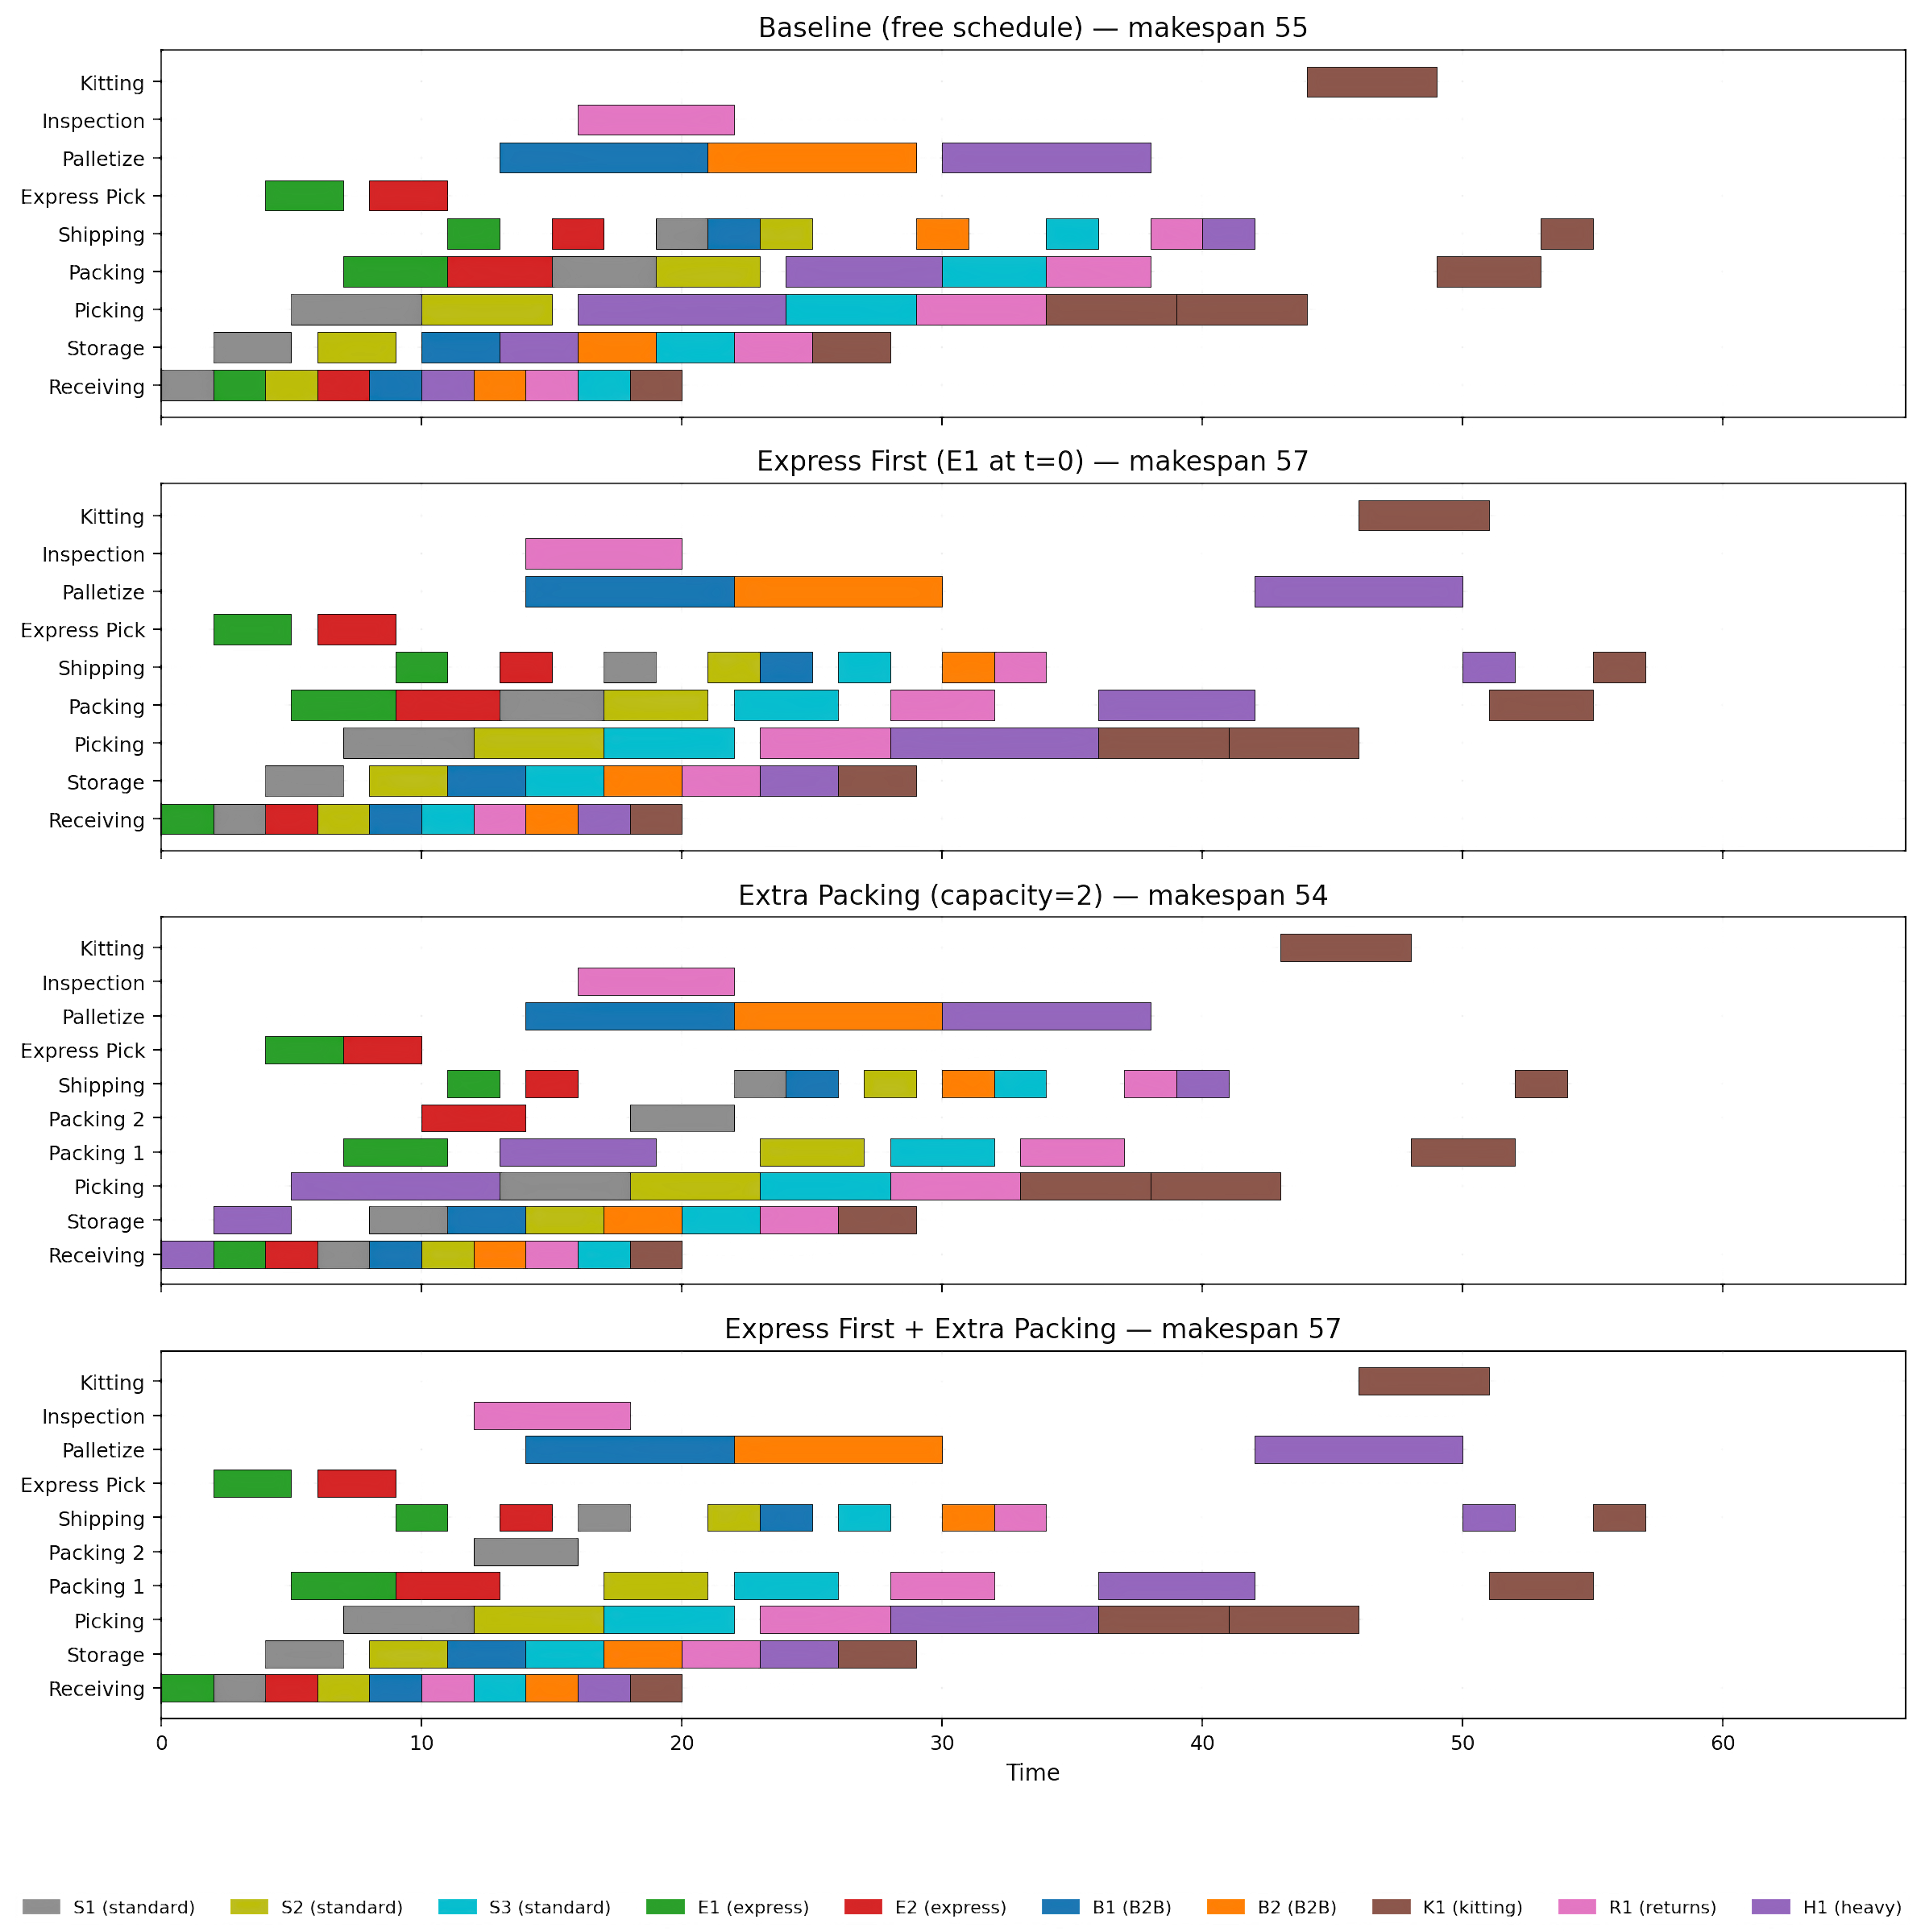
| Baseline (free schedule) | 55h | 35h | 4/10 | 24h |
| Express First (E1 at t=0) | 57h | 37h | 3/10 | 26h |
| Extra Packing (capacity=2) | 54h | 32h | 5/10 | 23h |
| Express First + Extra Packing | 57h | 37h | 3/10 | 26h |
Forcing express priority reduces the count of late jobs but increases total tardiness, and the benefit of extra Packing capacity disappears when express is forced to the front. Prioritising Express cuts late jobs from 4 to 3, but total tardiness climbs by 2 hours due to displacement of standard orders. Adding a second Packing station shaves 3 hours off total tardiness in the unconstrained schedule. However, when both interventions are combined, the extra station’s benefit evaporates: the system re-optimizes around Picking as the active constraint. This reflects scarce Packing capacity being reallocated to low-slack Express jobs, increasing delay propagation in Standard flows.
The business case for a second Packing station is weak in isolation: at $200/hour of tardiness cost, payback stretches to 50 weeks. It only makes sense as insurance, not as a throughput play.
Experiment 2: Machine Maintenance Windows
Which machine outage hurts the most?
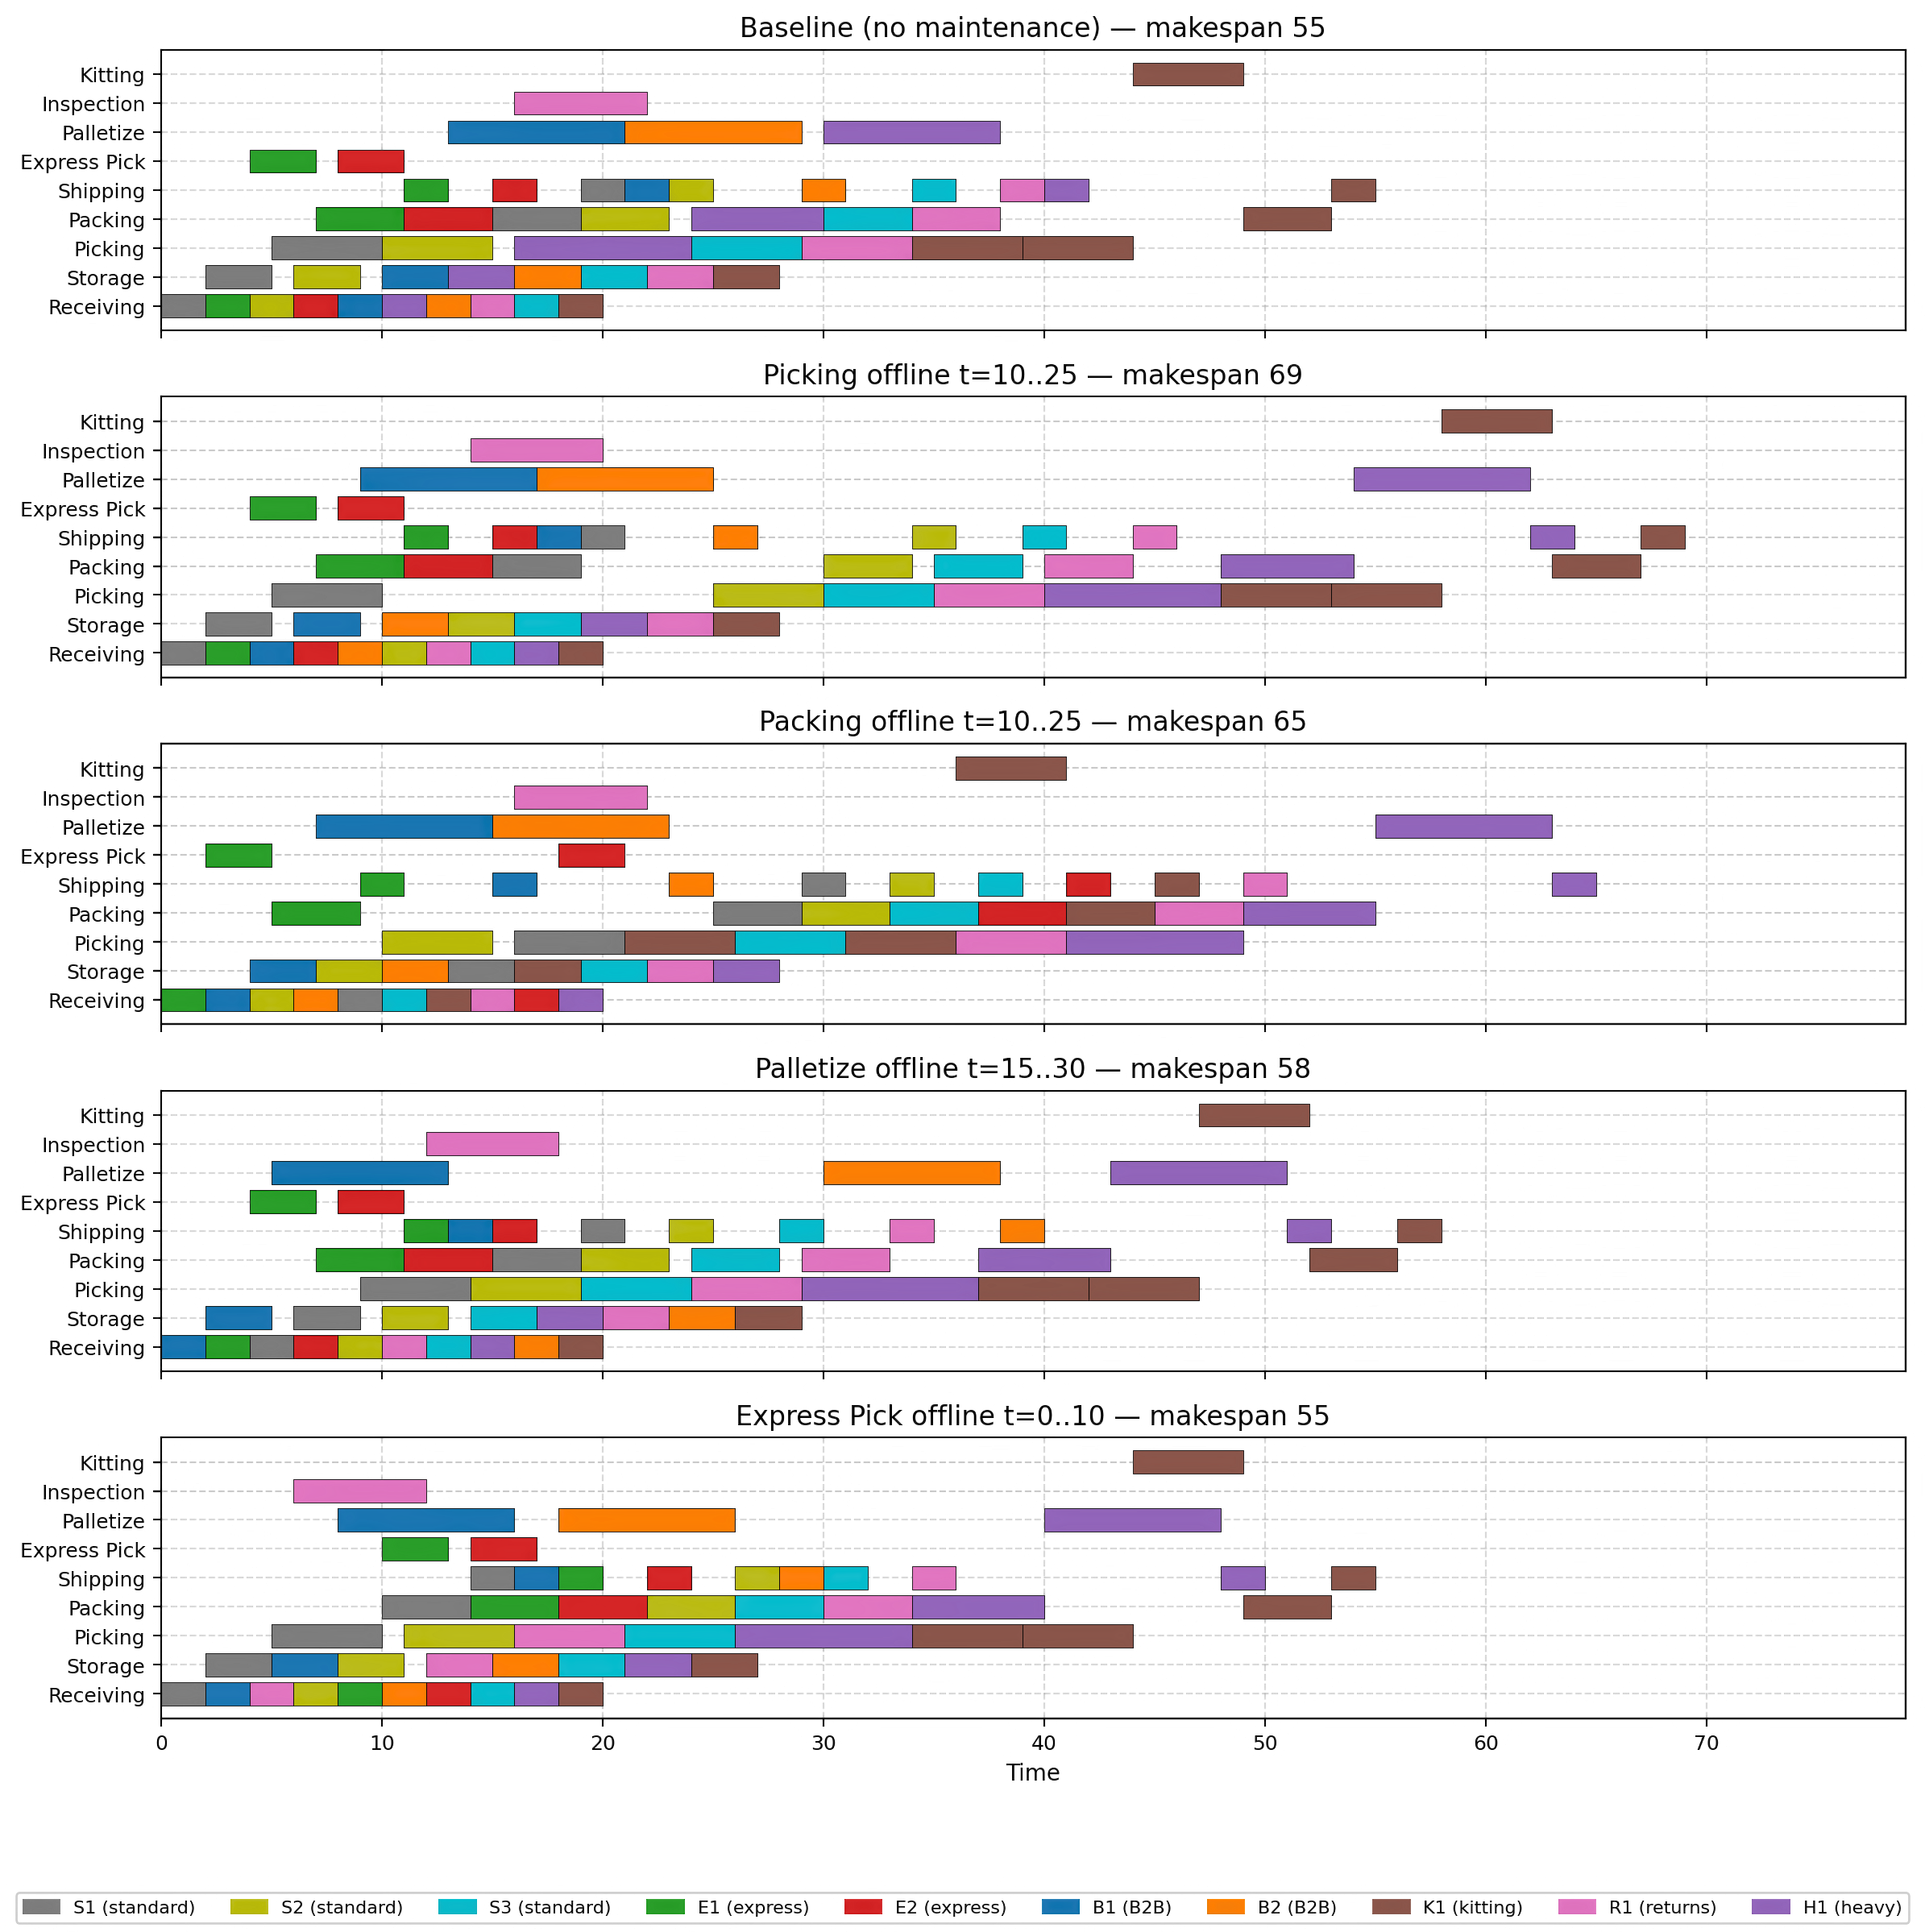
We block one machine at a time for a 15-hour maintenance window and measure the scheduling impact vs. baseline.
| Machine Down | Window | Makespan Δ | Tardiness Δ | Late Jobs |
|---|---|---|---|---|
| Picking | t=10..25 | +14h (+25%) | +55h (+157%) | 6/10 |
| Packing | t=10..25 | +10h (+18%) | +69h (+197%) | 7/10 |
| Palletize | t=15..30 | +3h (+5%) | +14h (+40%) | 5/10 |
| Express Pick | t=0..10 | 0h | +17h (+49%) | 5/10 |
Packing downtime has a disproportionately large effect on tardiness, worse than Picking downtime, despite Picking carrying more total load. Packing acts as a convergence node where upstream delays accumulate without downstream recovery capacity. Express Pick downtime is a sleeper risk: zero makespan impact but +17h tardiness. It only affects two jobs, but those are the Express orders with the tightest deadlines. Palletize downtime is manageable (+3h makespan, +14h tardiness), making it a sensible candidate for scheduled maintenance during operating hours.
Experiment 3: Throughput Saturation
How many extra Standard orders can the system absorb before it breaks?
We clone the Standard B2C order type incrementally (each clone adds 16h of work through the core Pick→Pack path) and test feasibility.
| Extra Clones | Total Jobs | Makespan | Tardiness | Incremental Tardiness |
|---|---|---|---|---|
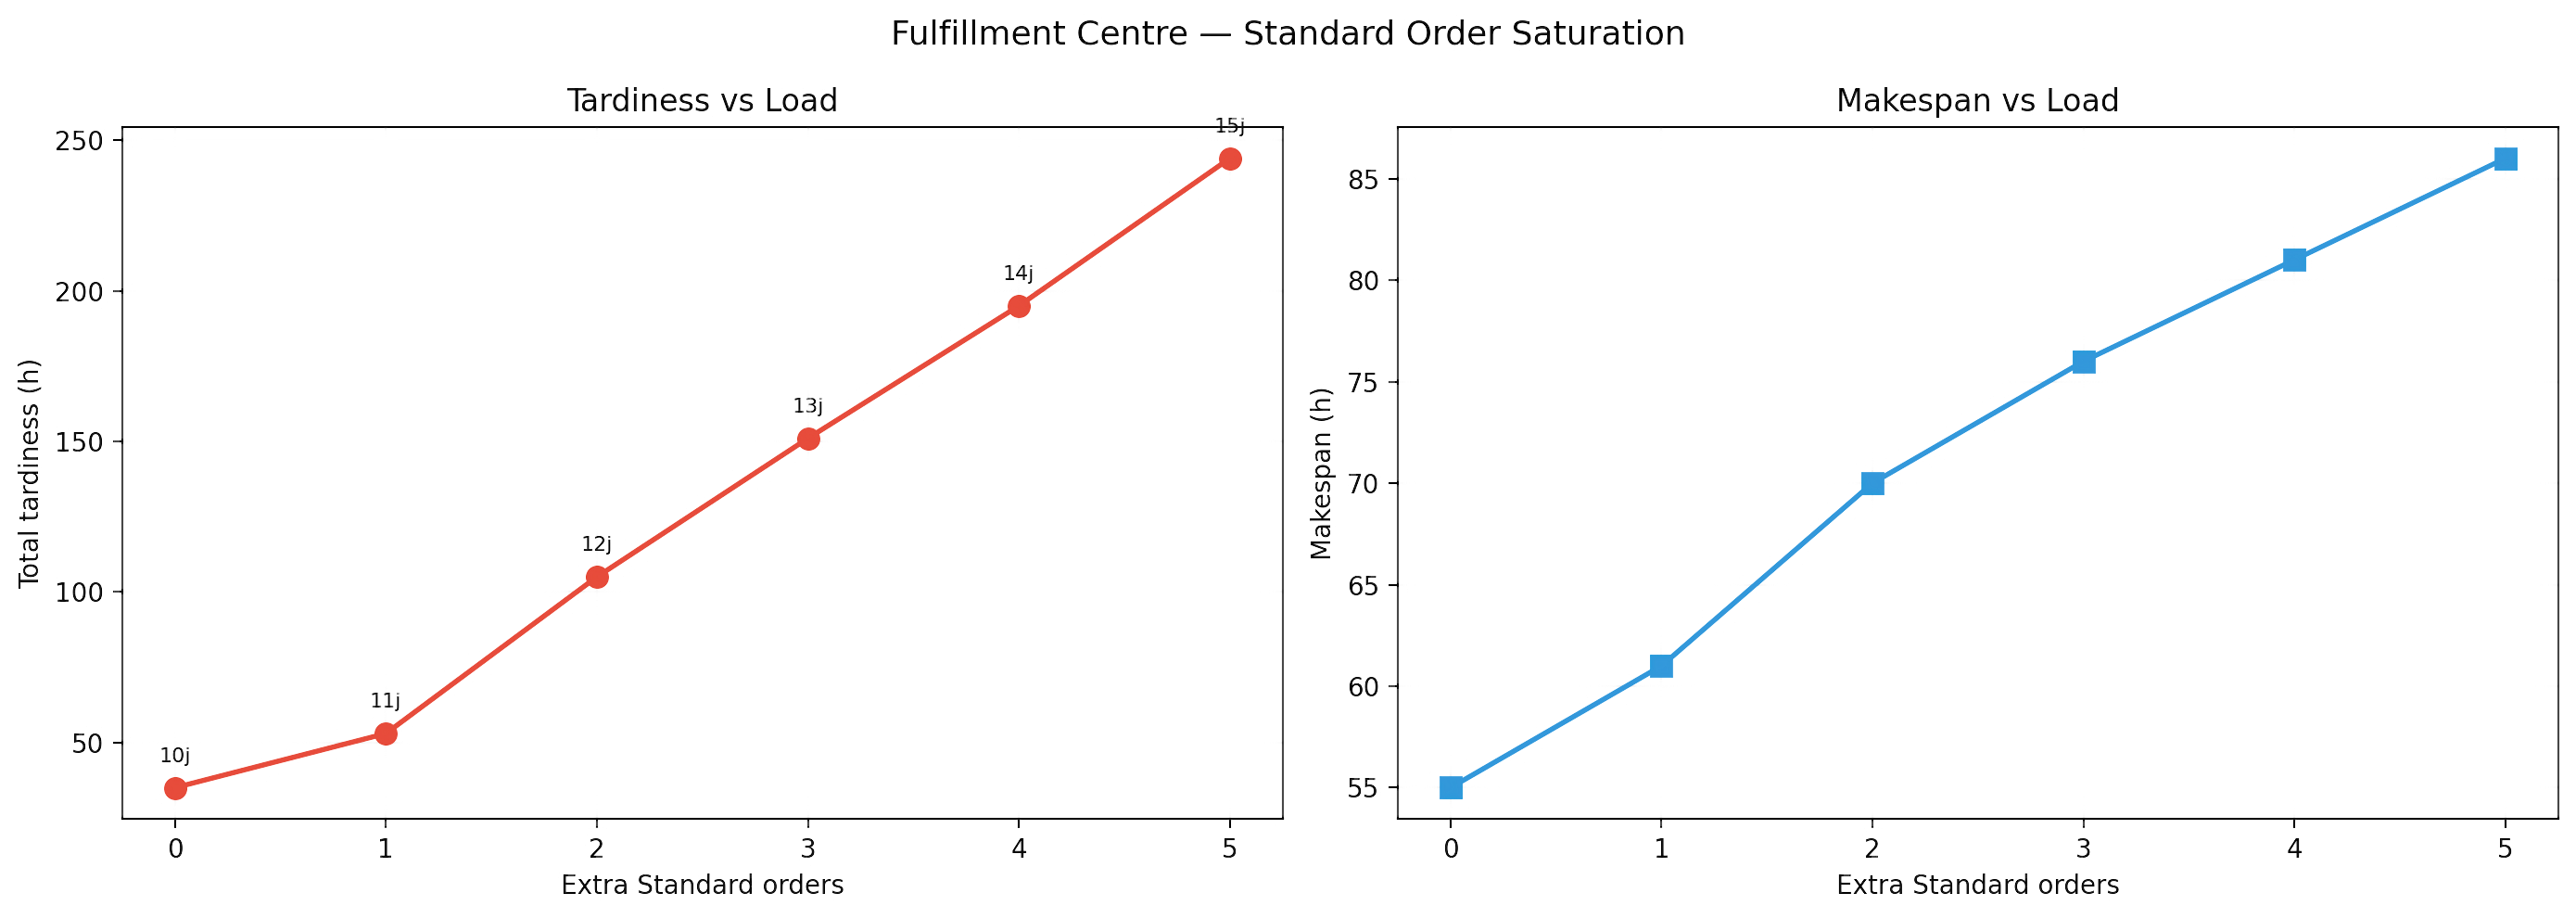
| 0 | 10 | 55h | 35h | - |
| 1 | 11 | 61h | 53h | +18h |
| 2 | 12 | 70h | 105h | +52h ← 3× jump |
| 3 | 13 | 76h | 151h | +46h |
| 4 | 14 | 81h | 195h | +44h |
| 5 | 15 | 86h | 244h | +49h |
| 6 | 16 | - | UNSATISFIABLE | - |
The system doesn’t degrade gradually, tardiness jumps 3× between the first and second extra order, and the solver finds no feasible schedule beyond 15 total jobs (50% above baseline).
A non-linear phase transition occurs between 11 and 12 jobs, where tardiness increases by ~3×, indicating a phase transition from congestion to instability.
Makespan grows linearly (+5–6h per clone), which is predictable. Tardiness does not. The first extra order costs 18h of additional tardiness. The second costs 52h. From there, each additional order piles on ~45–50h of new tardiness. At 15 jobs, cumulative tardiness hits 244h, a 7× increase over baseline. The sixth clone makes the problem unsatisfiable, the combined workload exceeds what the facility can schedule in any configuration.
The practical takeaway: the system absorbs +20% volume with manageable pain, but somewhere between +20% and +30% it crosses a threshold where every additional order cascades delays across the entire job set.
Business Implications
- End-of-line capacity dominates system tardiness due to absence of downstream buffering.
- Priority rules redistribute delay rather than eliminate it, often increasing system-wide tardiness.
- System performance exhibits a phase transition under increasing demand, rather than smooth degradation.
- Maintenance decisions should be driven by schedule sensitivity, not utilisation.
- Redundancy decisions should target tail-risk amplification rather than average utilisation.
Methodology
Experiments used MiniZinc with a CP-SAT solver under a 60-second time limit per scenario, targeting optimal or near-optimal solutions on a calibrated job-shop model with fixed routing, deterministic durations, and deadline constraints. Raw solver outputs, constraint files, and per-run reports are archived in the experiment subdirectories.